Anomaly Detection User Guide
This is a brief guide of how to read and correctly interpret anomaly detection graphics from time series data. We recommend all users to read through this guide before exploring Unusual Flow Changes graphics.
Data Anomaly
Anomaly is a broad concept, which may refer to many different types of events in time series. A spike of value, a shift of volatility, a violation of seasonal pattern, etc. could all be anomalous or normal, depending on the specific context. We have offered a set of common components that can be combined into various types of anomaly detection methods for different scenarios. A user should know what type of anomaly to detect, therefore can read and interpret graphic accordingly.
Outlier
An outlier is a data point whose value is significantly different from others. An outlier point in a time series exceeds the normal range of this series, without considering the temporal relationship between data points. In other words, even regarding all data points as time-independent, an outlier point still outstands.
Outlier is the most basic type of anomaly. Anomaly detection methods targeting at other types often transform a time series into a new one to which outlier detection is applied.
Anomaly Detection Methods
Inter Quartile Range Detector
This is a widely used anomaly detector based on interquartile range (IQR). When a value is out of the range defined by [Q1−c×IQR, Q3+c×IQR] where IQR=Q3−Q1 is the difference between 25% and 75% quantiles. This detector is usually preferred in the case where only a tiny portion or even none of data is anomalous.
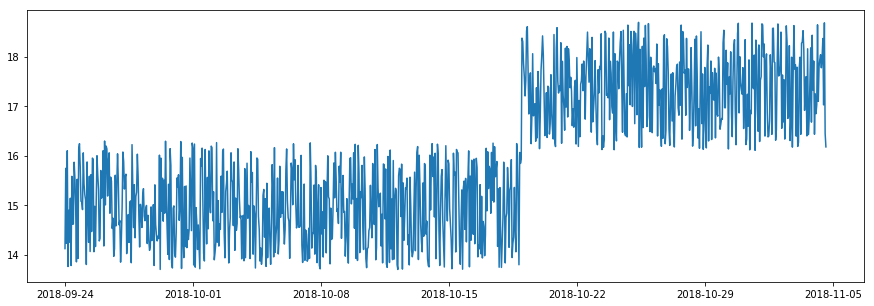
Spike and Level Shift
In some situations, whether a time point is normal depends on if its value is aligned with its near past. An abrupt increase or decrease of value is called a spike if the change is temporary, or a level shift if the change is permanent. Please note that, although a spike appears similar to an outlier, it is time-dependent while an outlier is time-independent. The value of a spike could be normal if examing with all data points without considering temporal order (see figure below).
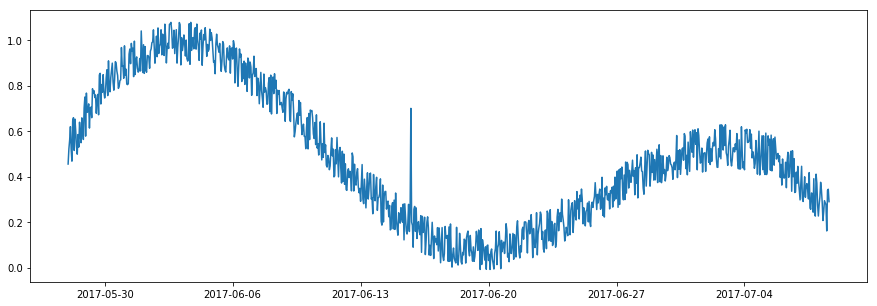
For detecting Spikes and Level Shifts, Level Shift could also be a good choice.
Pattern Change
The strategy mentioned above could be generalized to detect the shift of patterns other than value. For example, if shifts of volatility is of interest, the statistic to track in time observation windows can be standard deviation instead of mean/median.
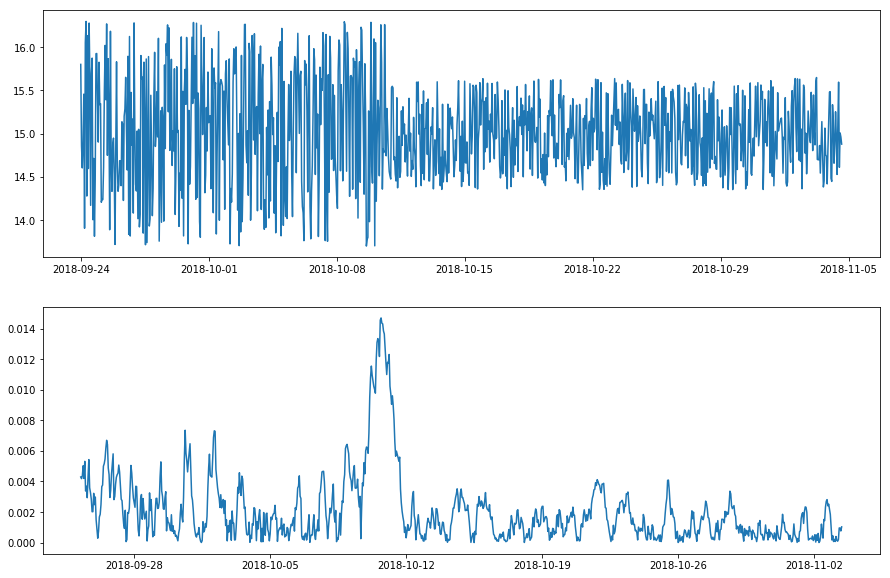
For detecting temporal changes of pattern, Double Rolling Aggregate Method could also be a good choice. It slides a time window and returns a statistic measured inside the window that quantifies a temporal pattern. For example, if a user wants to detect temporary anomalously high flow heights, tracking flow heights in sliding window is an effective approach.
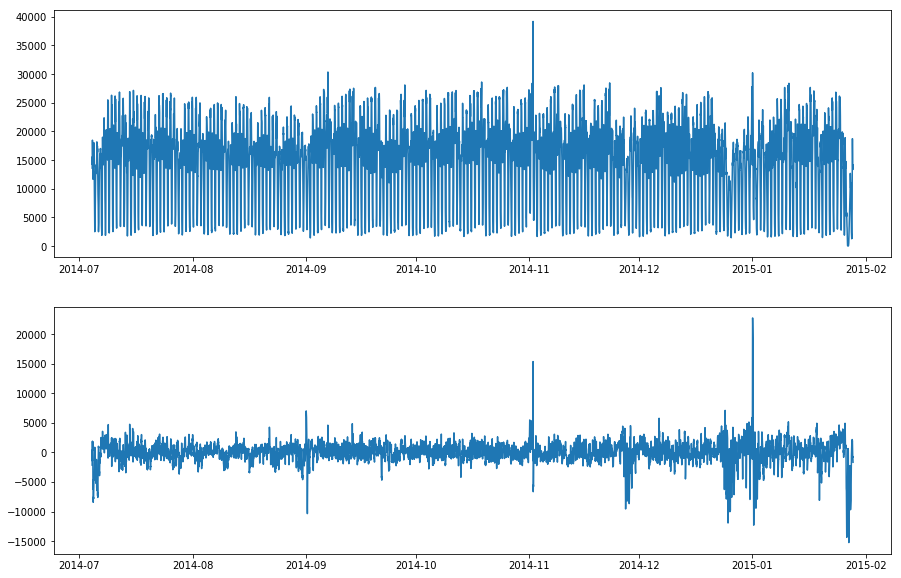
Seasonality
A seasonal pattern exists when a time series is influenced by seasonal factors (e.g. the hour of the day, the day of the week, the month of the year). Seasonal Decomposition detector method uses data transformers to remove the seasonal pattern from the original time series, and highlight time period when the time series does not follow the seasonal pattern normally by examing the residual series. For this to work, unfortunately, all data gaps must be filled. A dataset with missing data can not be used in this case.
A user needs to be careful about distinguishing seasonal series and cyclic series. A seasonal series always has a fixed, usually interpretable and known, period because of its seasonal nature. A cyclic time series does not follow a fixed periodic pattern because of its physics nature, even if it appears repeating similar subseries. For example, the trajectory of a moving part in rotating equipment is a 3-D cyclic time series, whose cycle length depends on rotation speed and is not necessarily fixed. Applying seasonality decomposition to it would be problematic, because every cycle may last a slightly different length, and decomposition residuals will be misleading for anomaly detection purpose.