Data Tables
Data is the core engine of this website. Without this data, we couldn't support evidence-based decision making process and formulation of water resources management policies. We have made our data accessible to general public for their unique use case which may require processing and analysis which is not covered on this website.
This data is available on our website in two forms namely:
- Embended Data Tables
- API Endpoints
Embended Data Tables
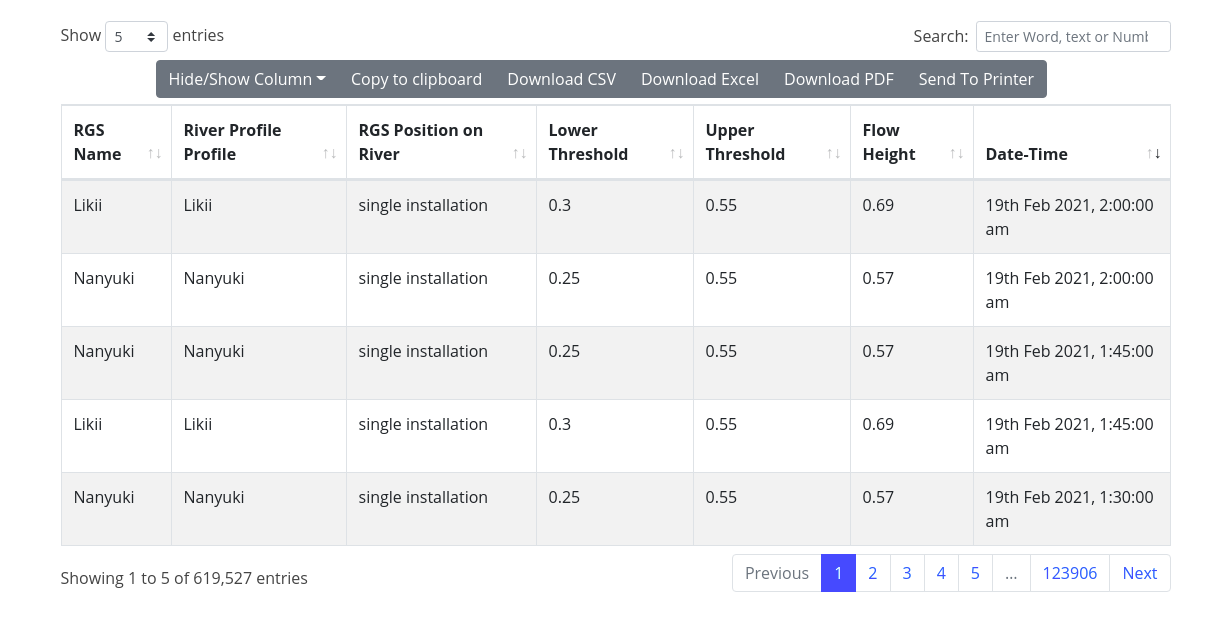
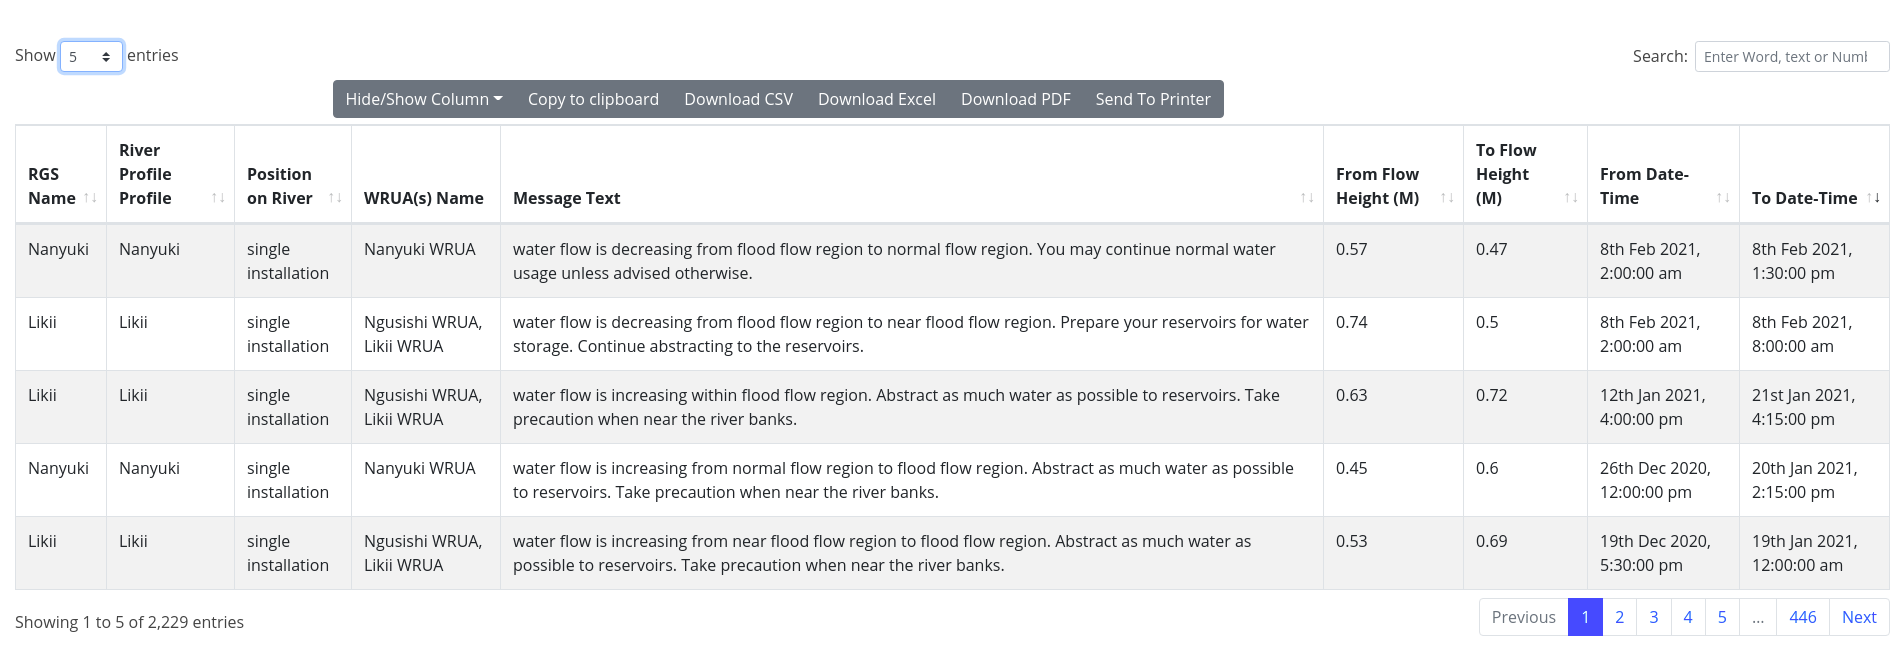
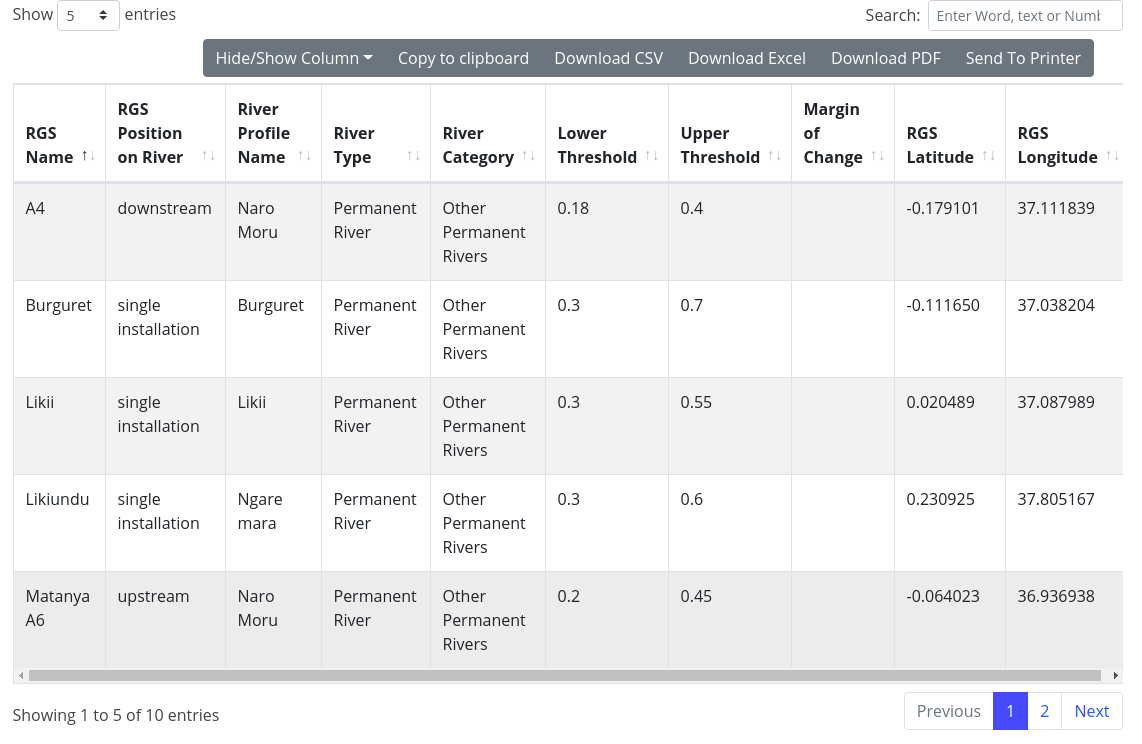
These are data tables on the website in the Datasets navigation tab. The data tables have been developed from modern technology that adds live interactions and analysis of the data on-the-go. By default, the length of data table rows on displayed is 5. This number be increased to 10, 25, 50 or 100 depending on user requirements. Similarly, the data can be sorted along columns with capability of shifting column position. To re-order columns, drag-drop the columns from current positions to new position. The search input on every table supports fuzzy and regular expression search. A powerful widget that enables hiding/showing table column(s), copying of table data into clipboard, downloading the data in csv format, downloading excel, downloading pdf or sending the data to printer is included on every table. Data exported or sent to printer includes all columns, even the hidden. Sometimes, these data columns may not fit into small print paper sizes. We advise using large paper prints or exporting an excel which can be manipulated to custom print size using external software.
Raw Data
This data can be accessed from this page

Day-by-Day Aggregates
This data can be accessed from this page

Week-by-Week Aggregates
This data can be accessed from this page

Broadcast Messages
This data can be accessed from this page

River Profiles
This data can be accessed from this page
